- Регистрация
- 27 Авг 2018
- Сообщения
- 37,268
- Реакции
- 524,131
- Тема Автор Вы автор данного материала? |
- #1

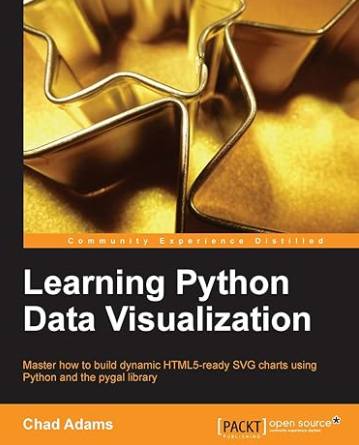
Master how to build dynamic HTML5-ready SVG charts using Python and the pygal library
About This Book:
- A practical guide that helps you break into the world of data visualization with Python
- Understand the fundamentals of building charts in Python
- Packed with easy-to-understand tutorials for developers who are new to Python or charting in Python
Who This Book Is For:
If you are a Python novice or an experienced developer and want to explore data visualization libraries, then this is the book for you. No prior charting or graphics experience is needed.What You Will Learn:
- Build different types of Python charts and graphs
- Master how to build Python graphics libraries
- Test and validate your data sources
- Explore common Python libraries for charts and graphics
- Build charts using dynamic data from offline and online sources
- Use CSS to modify embedded SVG images in HTML pages
- Install and write Python code on Windows, Mac, or Linux
- Discover how to install and reference libraries in Visual Studio or Eclipse
In Detail:
The best applications use data and present it in a meaningful, easy-to-understand way. Packed with sample code and tutorials, this book will walk you through installing common charts, graphics, and utility libraries for the Python programming language.Firstly you will discover how to install and reference libraries in Visual Studio or Eclipse. We will then go on to build simple graphics and charts that allow you to generate HTML5-ready SVG charts and graphs, along with testing and validating your data sources. We will also cover parsing data from the Web and offline sources, and building a Python charting application using dynamic data. Lastly, we will review other popular tools and frameworks used to create charts and import/export chart data. By the end of this book, you will be able to represent complex sets of data using Python.
INFORMATION PAGE:
DOWNLOAD:


